Senior Design Team 14 • Senior Design Project Site
Computer Science 3090 Dashboard
Project Abstract
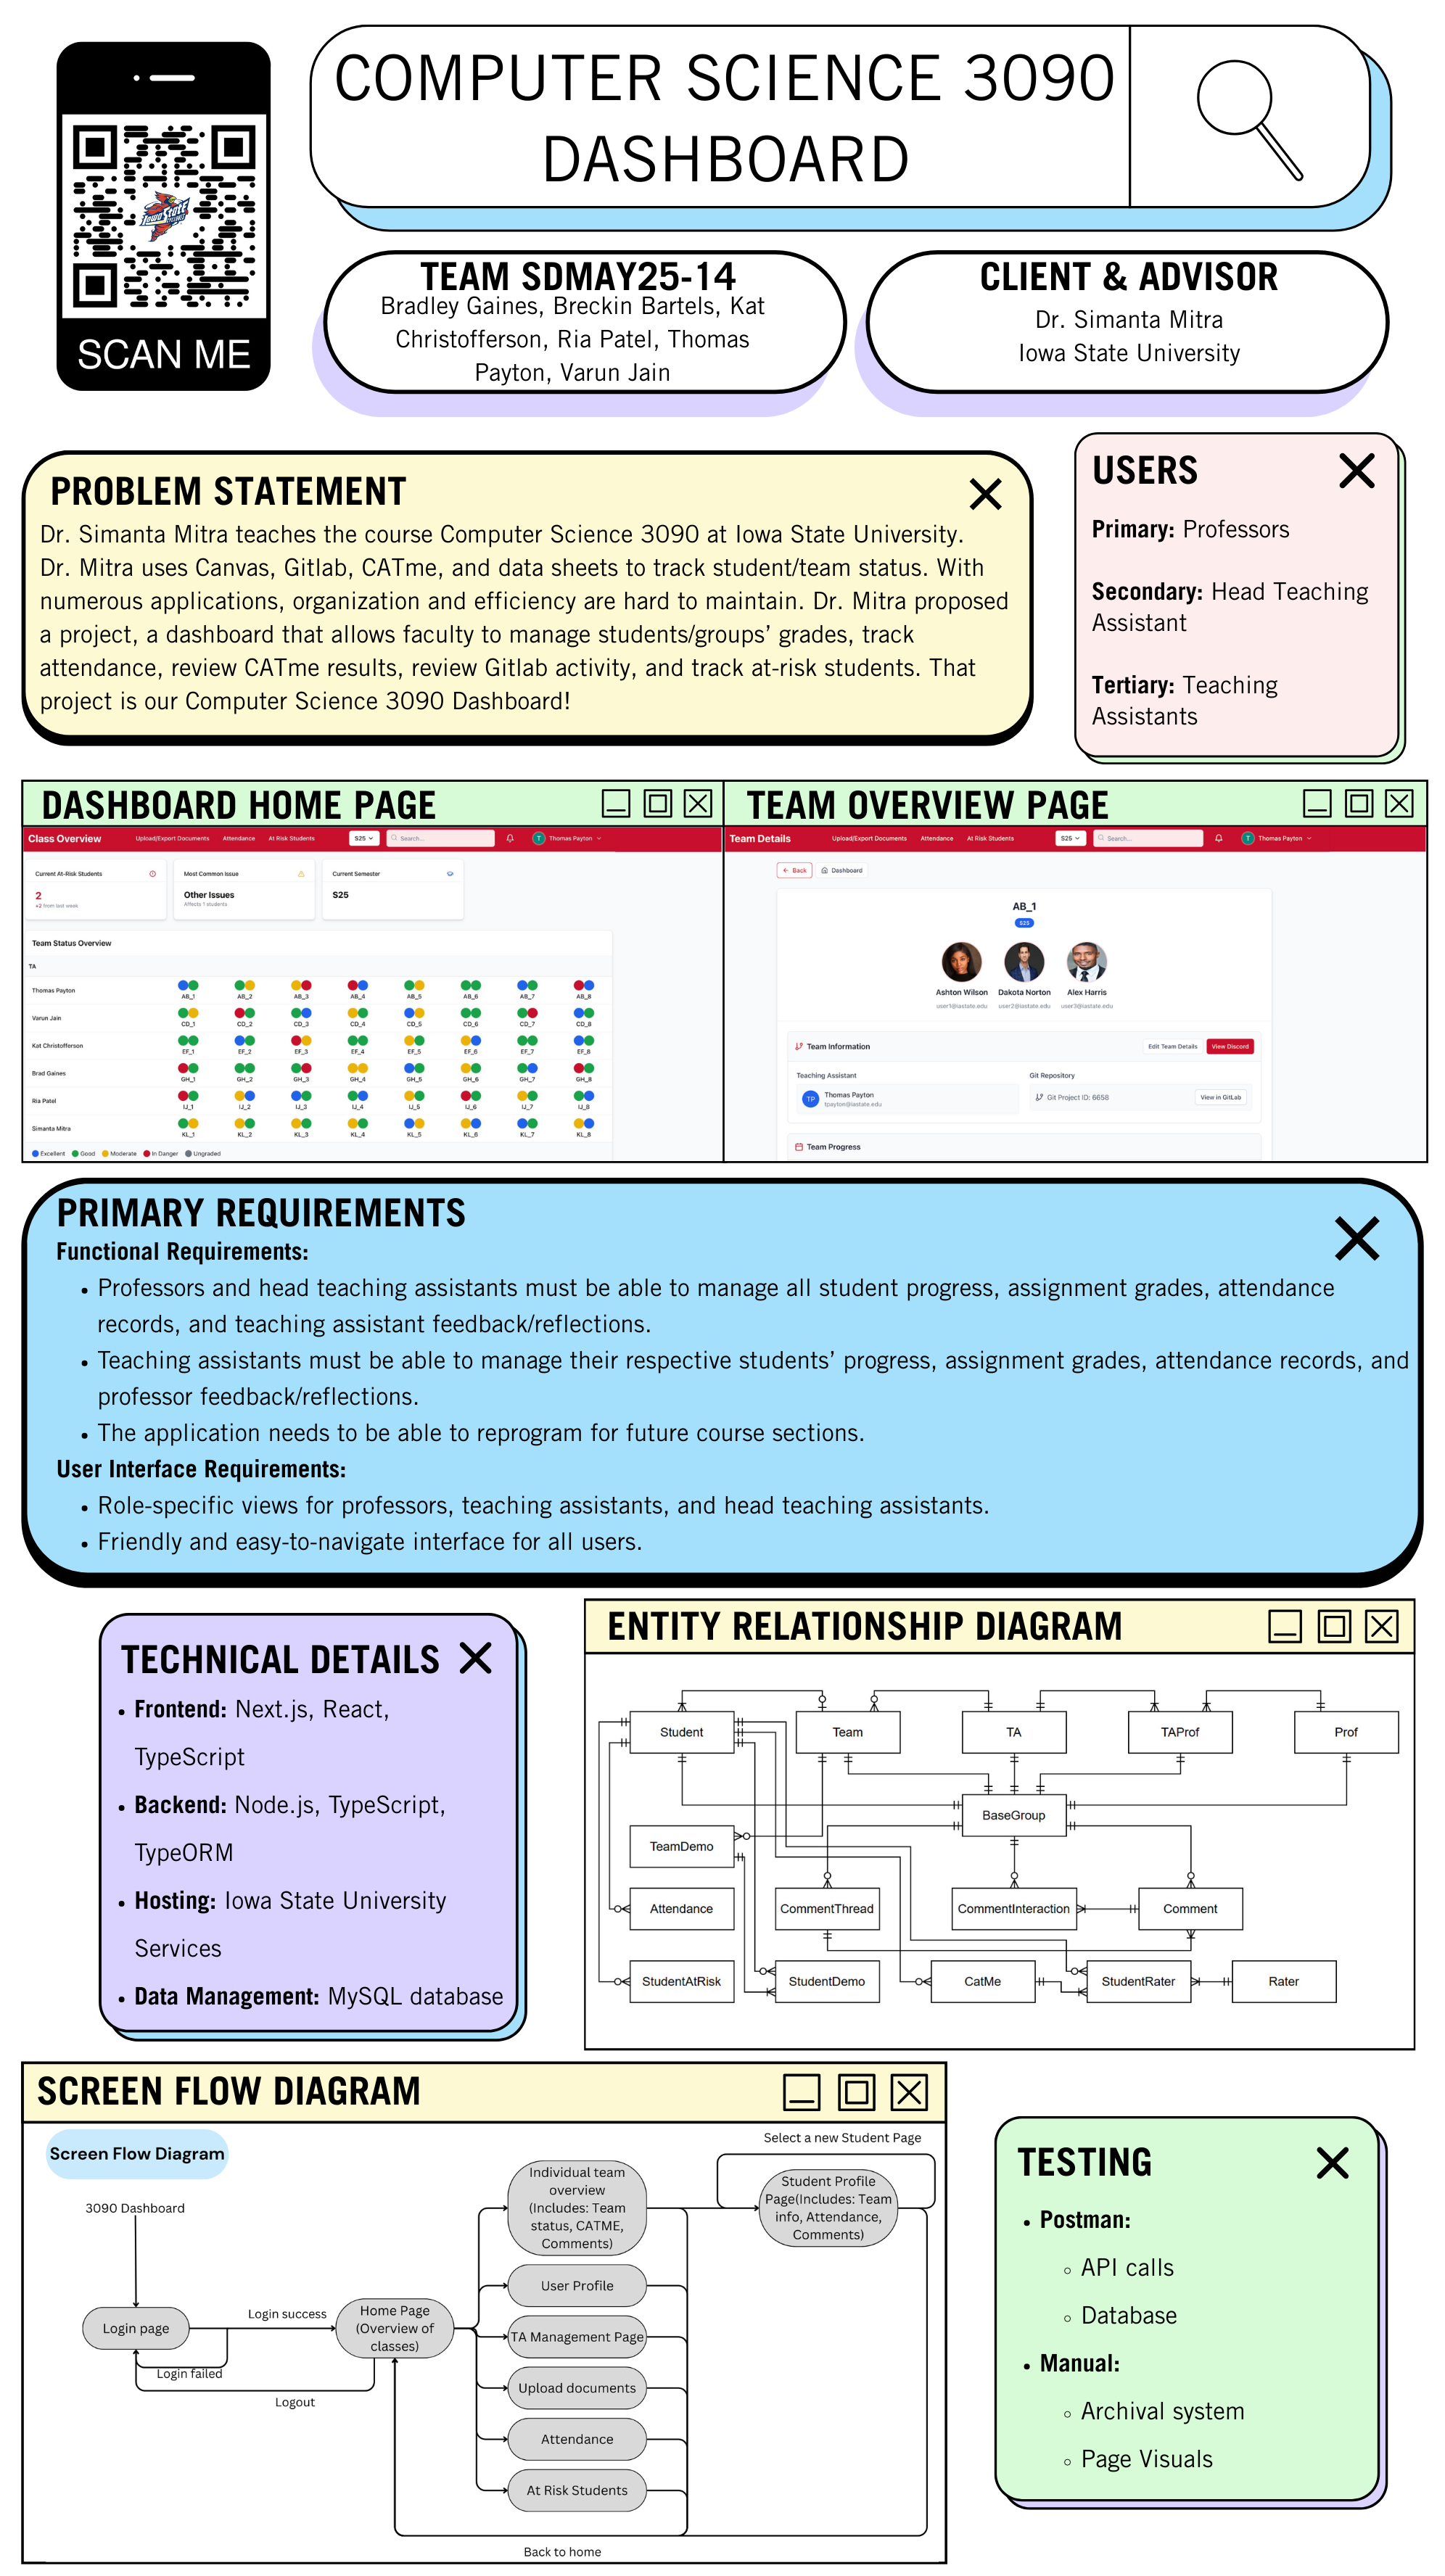
Dr. Simanta Mitra teaches the course Computer Science 3090 at Iowa State University. Dr. Mitra uses Canvas, Gitlab, CATme, and datasheets to track student/group status. With numerous applications, organization and efficiency are hard to maintain. Dr. Mitra proposed a project, a dashboard that allows faculty to review students/groups grades, track attendance, review CATme results, review Gitlab activity, and track at-risk students. That project is our Computer Science 3090 Dashboard! Our final implementation is focused on the needs of the primary user, the professor (Dr. Mitra). Future additions can be made to the dashboard to help satisfy the specific needs of the secondary and tertiary users. Next implementation steps for a future senior design team are elucidated in great detail in the design document. Thank you Dr. Mitra for giving us the opportunity to create a dashboard that will benefit the faculty of Computer Science 3090, and possibly other courses in the future!Dashboard Demo
Team Members
Bradley Gaines
Component Design, Cross-Component Integration, Testing

Major: Computer Engineering
Breckin Bartels
Component Design, Cross-Component Integration, Testing

Major: Software Engineering
Kat Christofferson
Component Design, Cross-Component Integration, Testing

Major: Cybersecurity Engineering
Ria Patel
Project Manager, Cross-Component Integration, Testing

Major: Electrical Engineering
Emphasis: Computer Engineering
Thomas Payton
Component Design, Cross-Component Integration, Testing

Major: Software Engineering
Minor: Cybersecurity Engineering
Varun Jain
Component Design, Cross-Component Integration, Testing

Major: Computer Engineering
Final Deliverables
Fall 2024
Design Document
Faculty Panel Presentation
Spring 2025
Design Document
Project Poster
Industry Representative Panel Presentation
Weekly Reports
Team Members
Bradley Gaines
Component Design, Cross-Component Integration, Testing
Major: Computer Engineering
Breckin Bartels
Component Design, Cross-Component Integration, Testing
Major: Software Engineering
Kat Christofferson
Component Design, Cross-Component Integration, Testing
Major: Cybersecurity Engineering
Ria Patel
Project Manager, Cross-Component Integration, Testing
Major: Electrical Engineering
Emphasis: Computer Engineering
Thomas Payton
Component Design, Cross-Component Integration, Testing
Major: Software Engineering
Minor: Cybersecurity Engineering
Varun Jain
Component Design, Cross-Component Integration, Testing
Major: Computer Engineering
Fall 2024
(1) August 26 to September 9
(2) September 20 to September 26
(3) September 27 to October 3
(4) October 4 to October 11
(5) October 12 to October 18
(6) October 19 to October 25
(7) October 26 to November 1
(8) November 2 to November 8
(9) November 9 to November 15
(10) November 16 to November 22
Spring 2025
(1) December 10 to January 30(2) January 31 to February 13
(3) February 14 to February 28
(4) February 28 to March 13
(5) March 14 to April 3
(6) April 4 to April 17
Diagrams and Schematics
Overall
Initial Design SketchesGantt Chart (Semester 1)
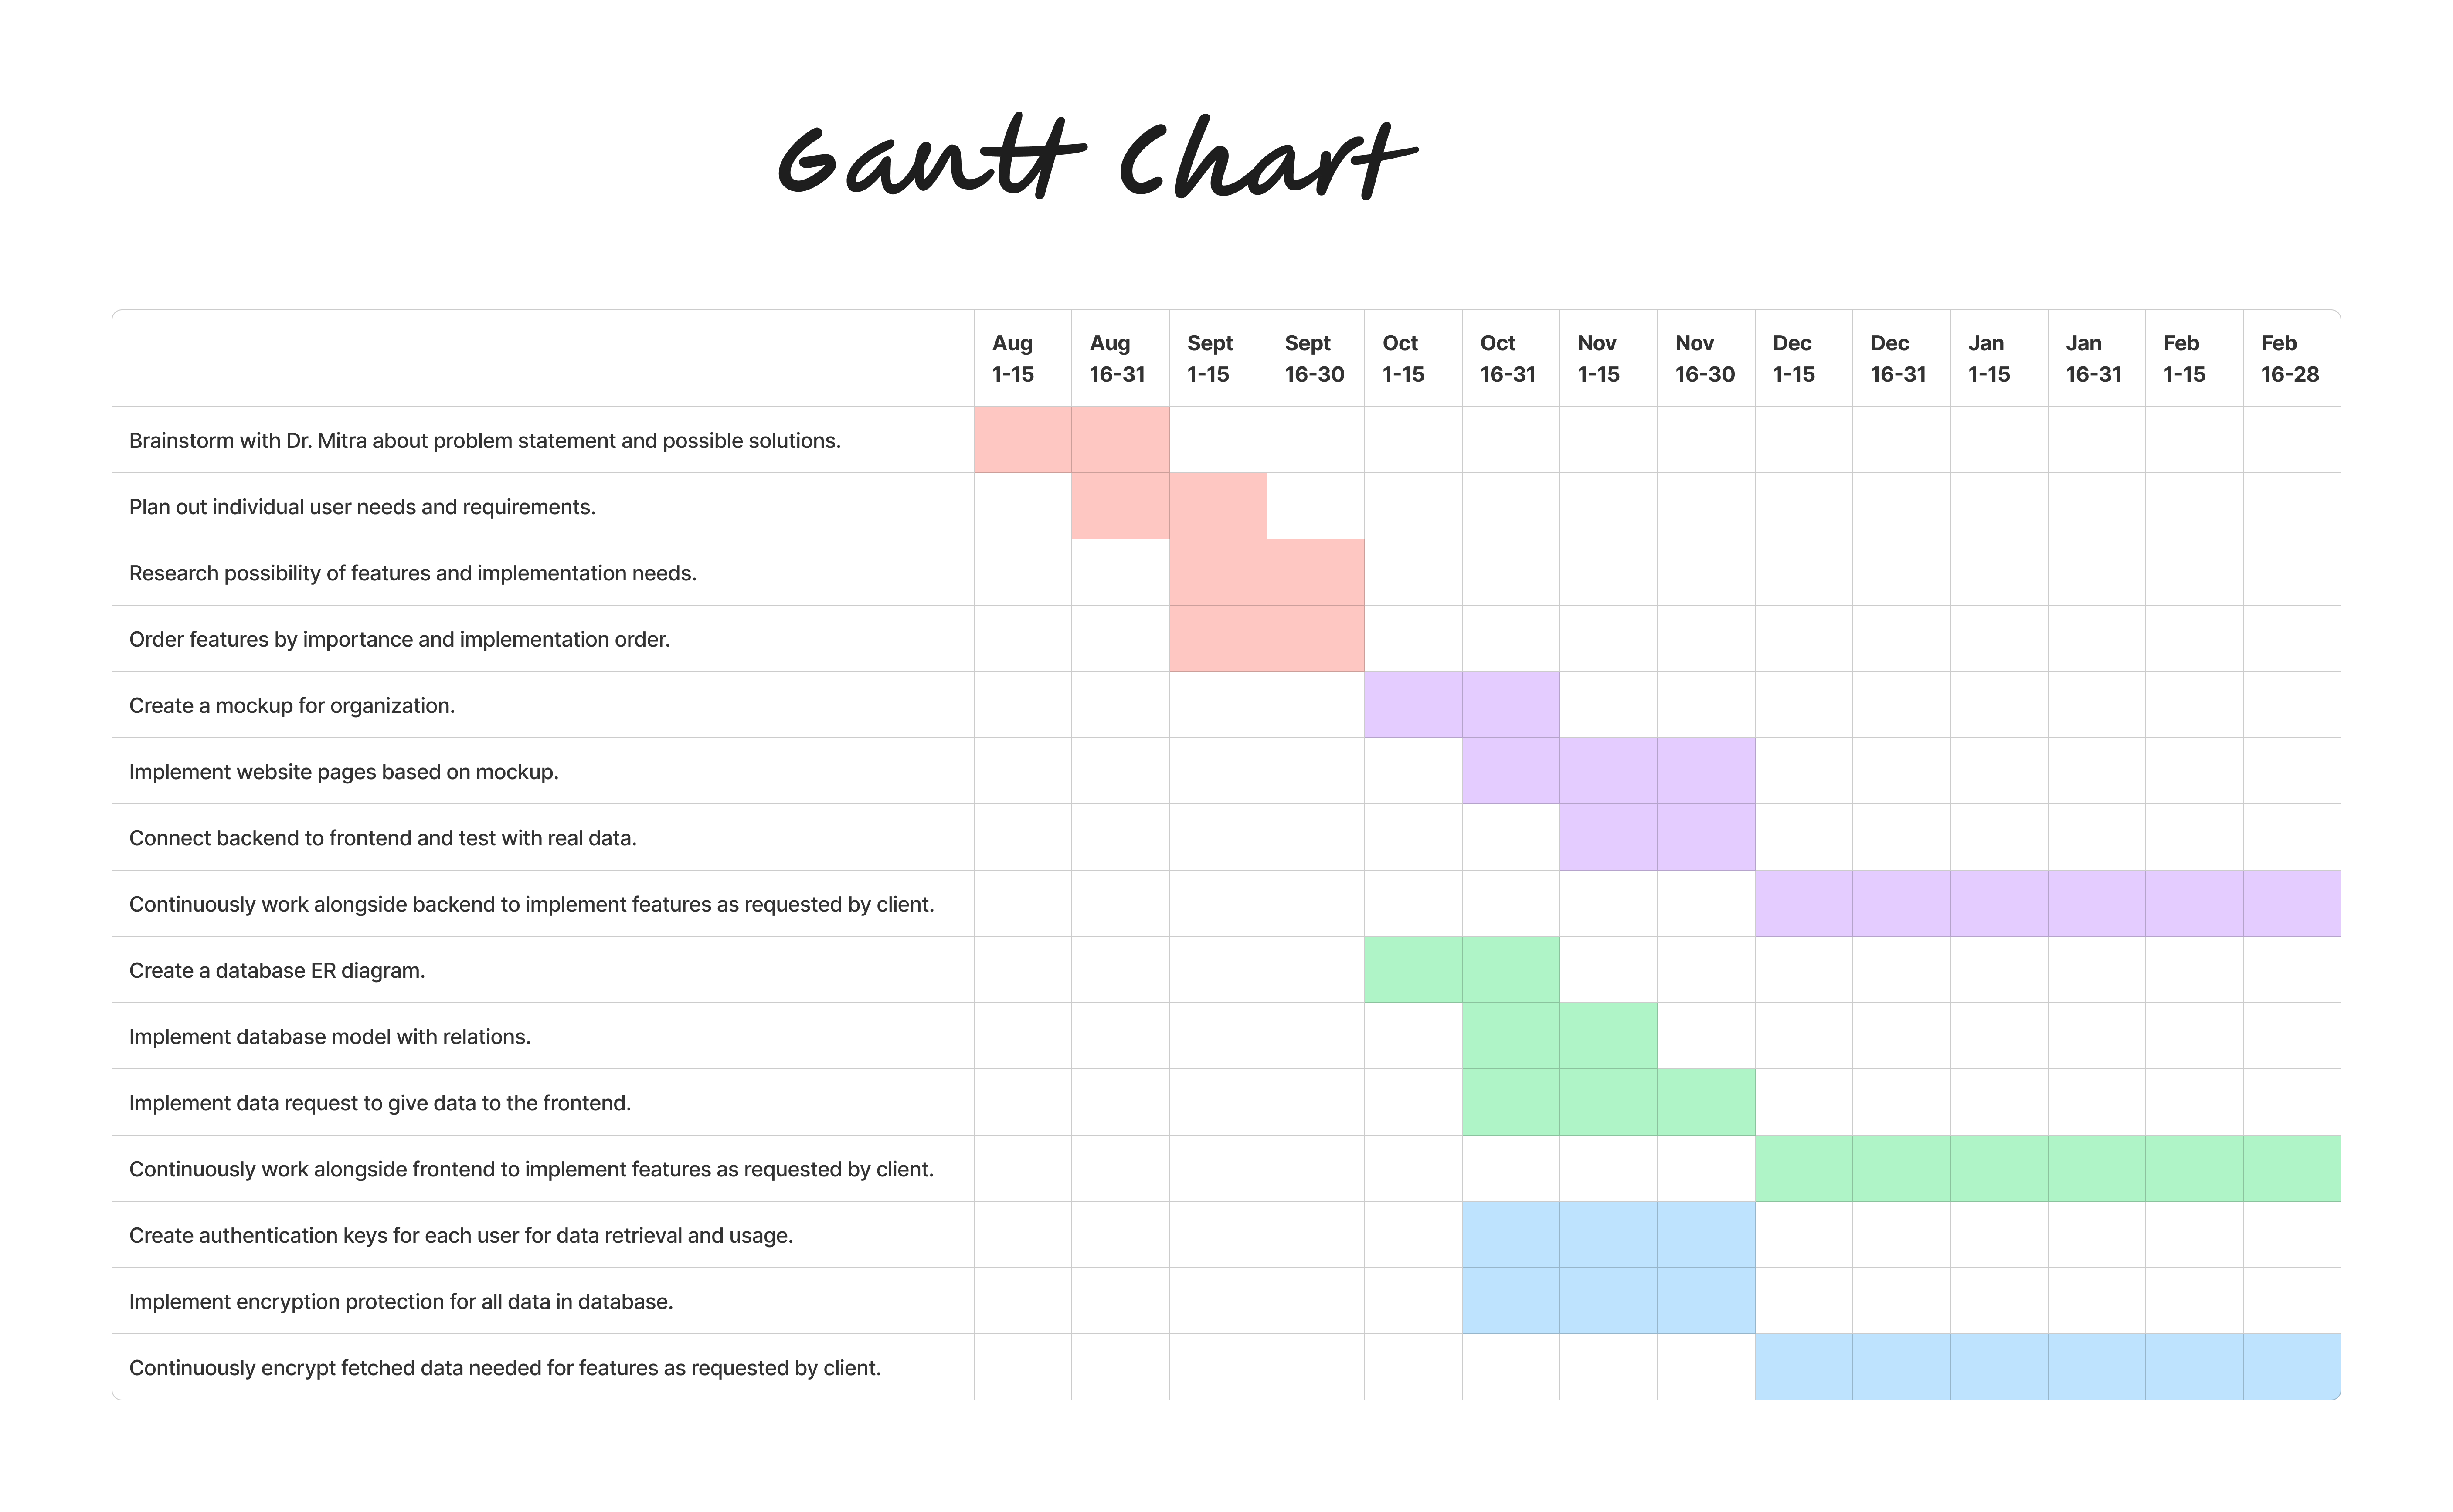
Gantt Chart (Semester 2)
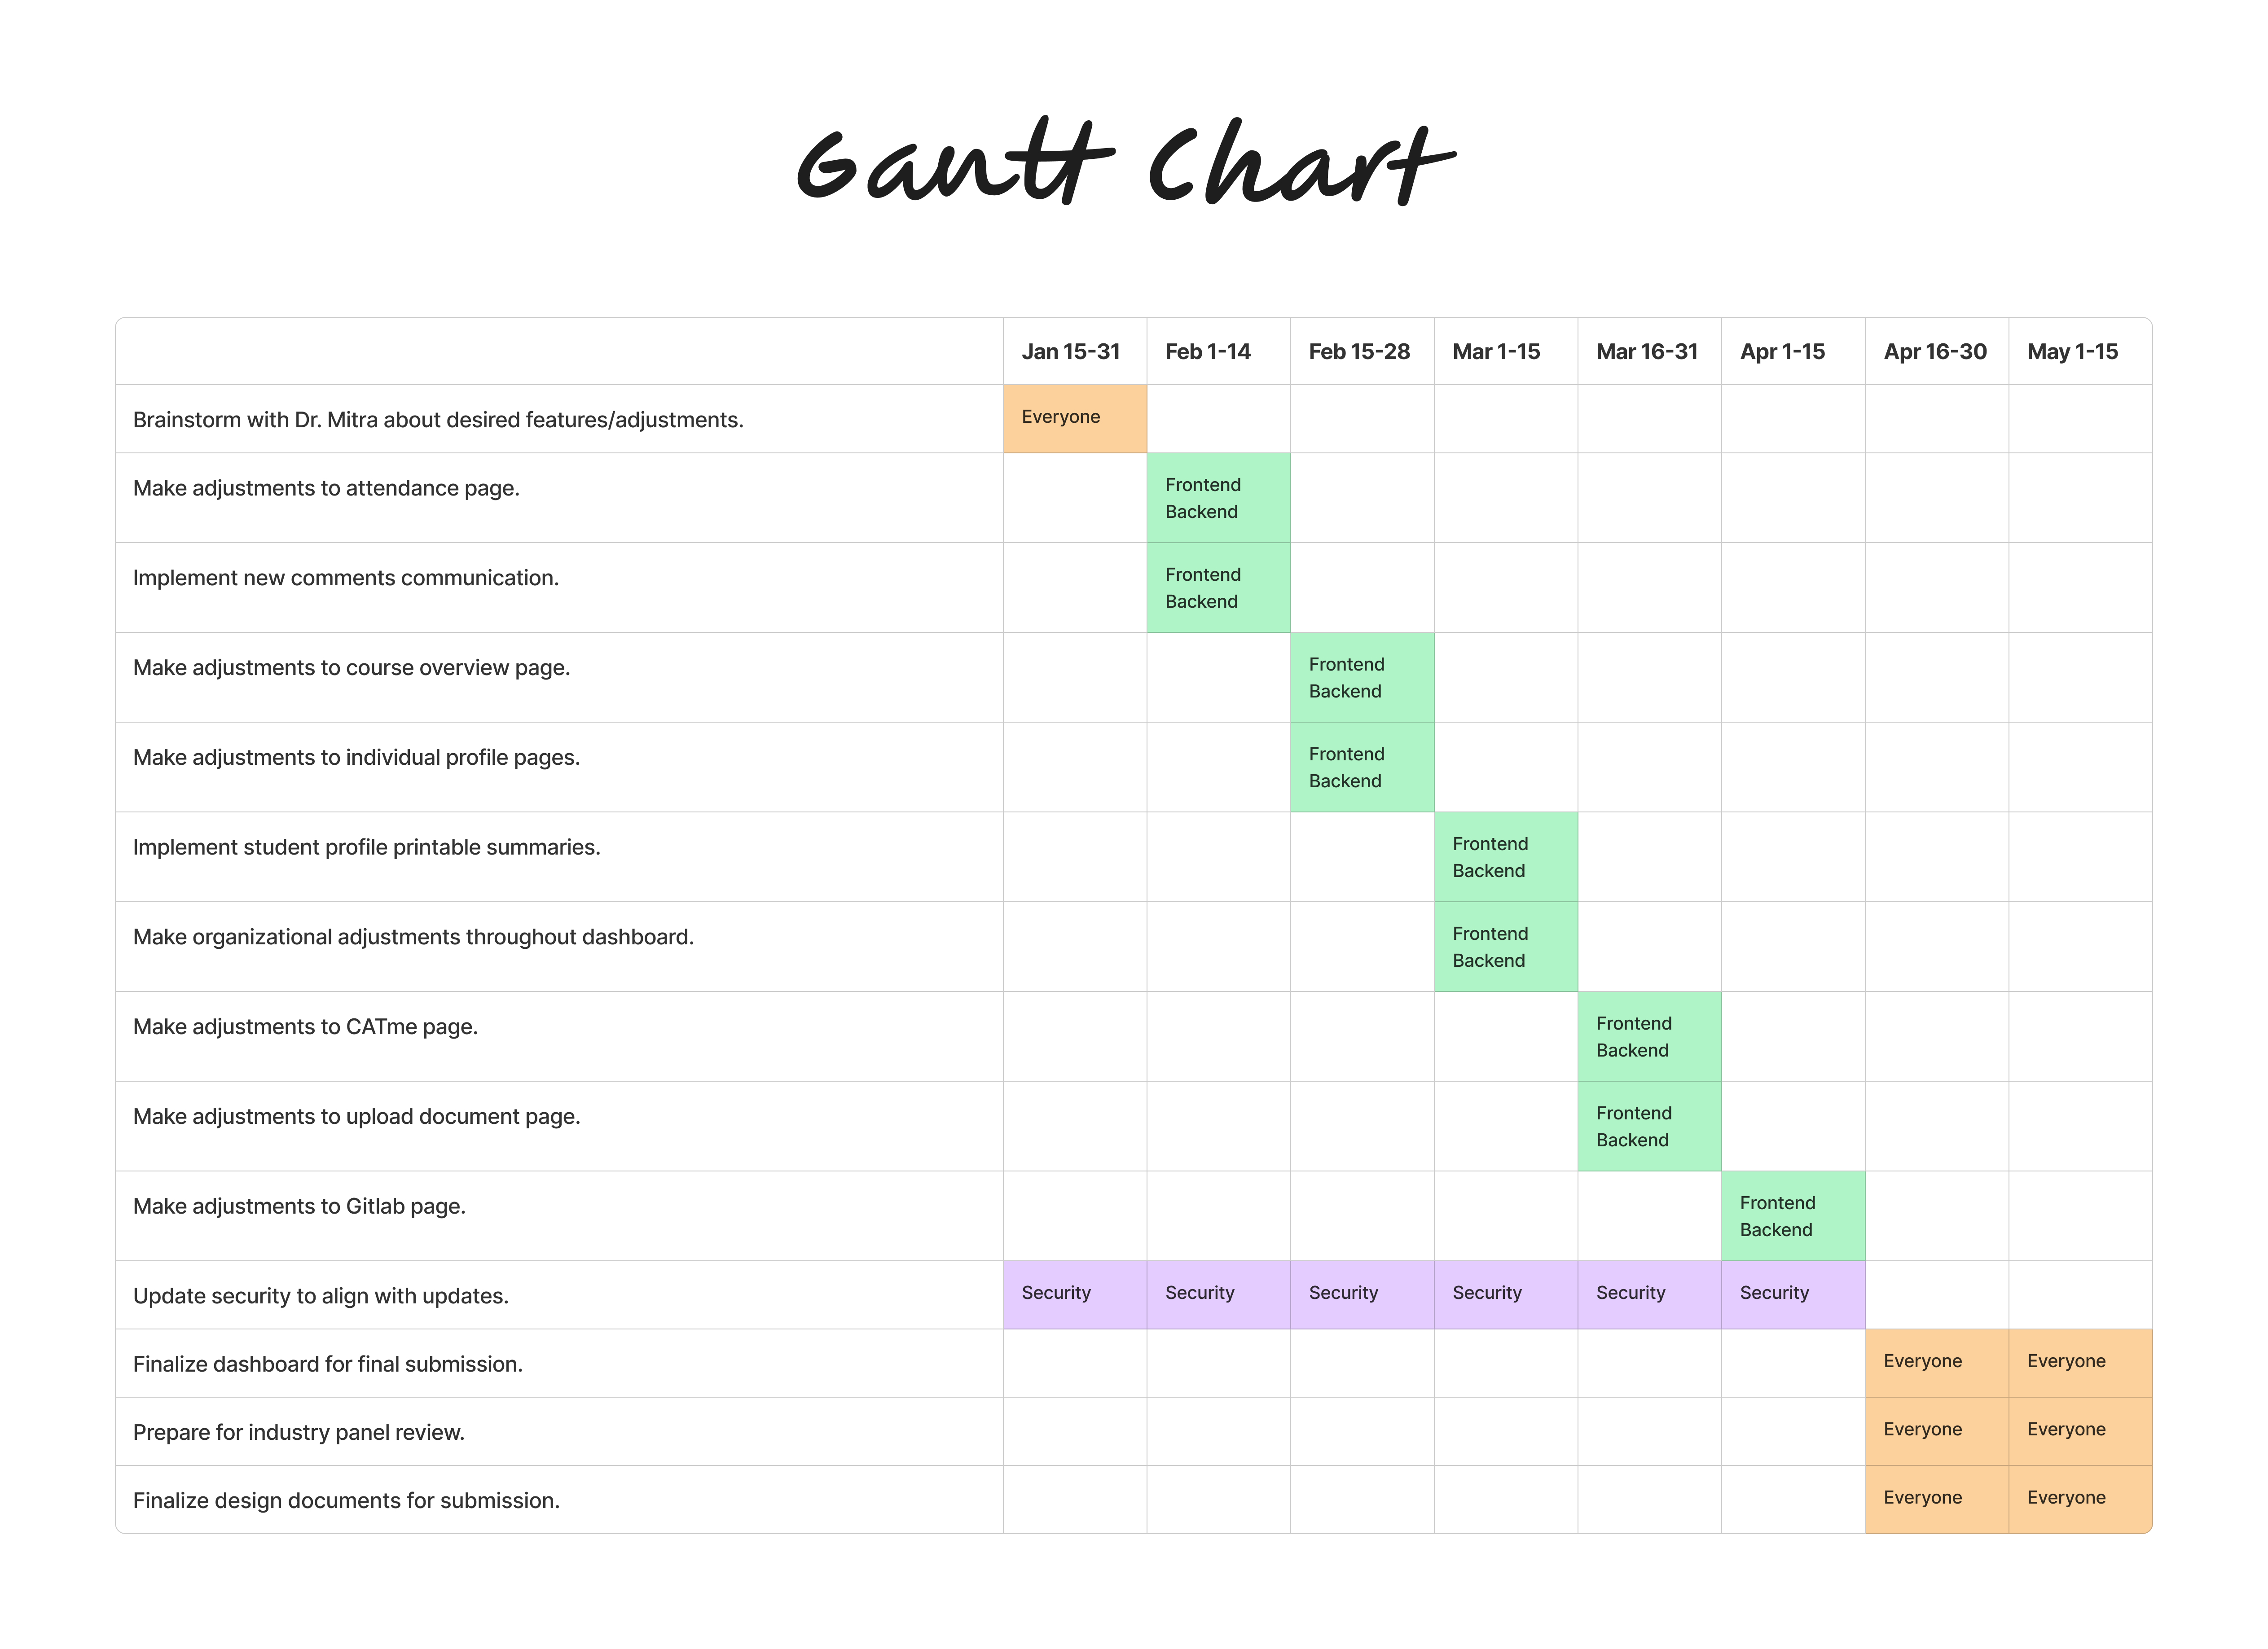
Task Decomposition Chart
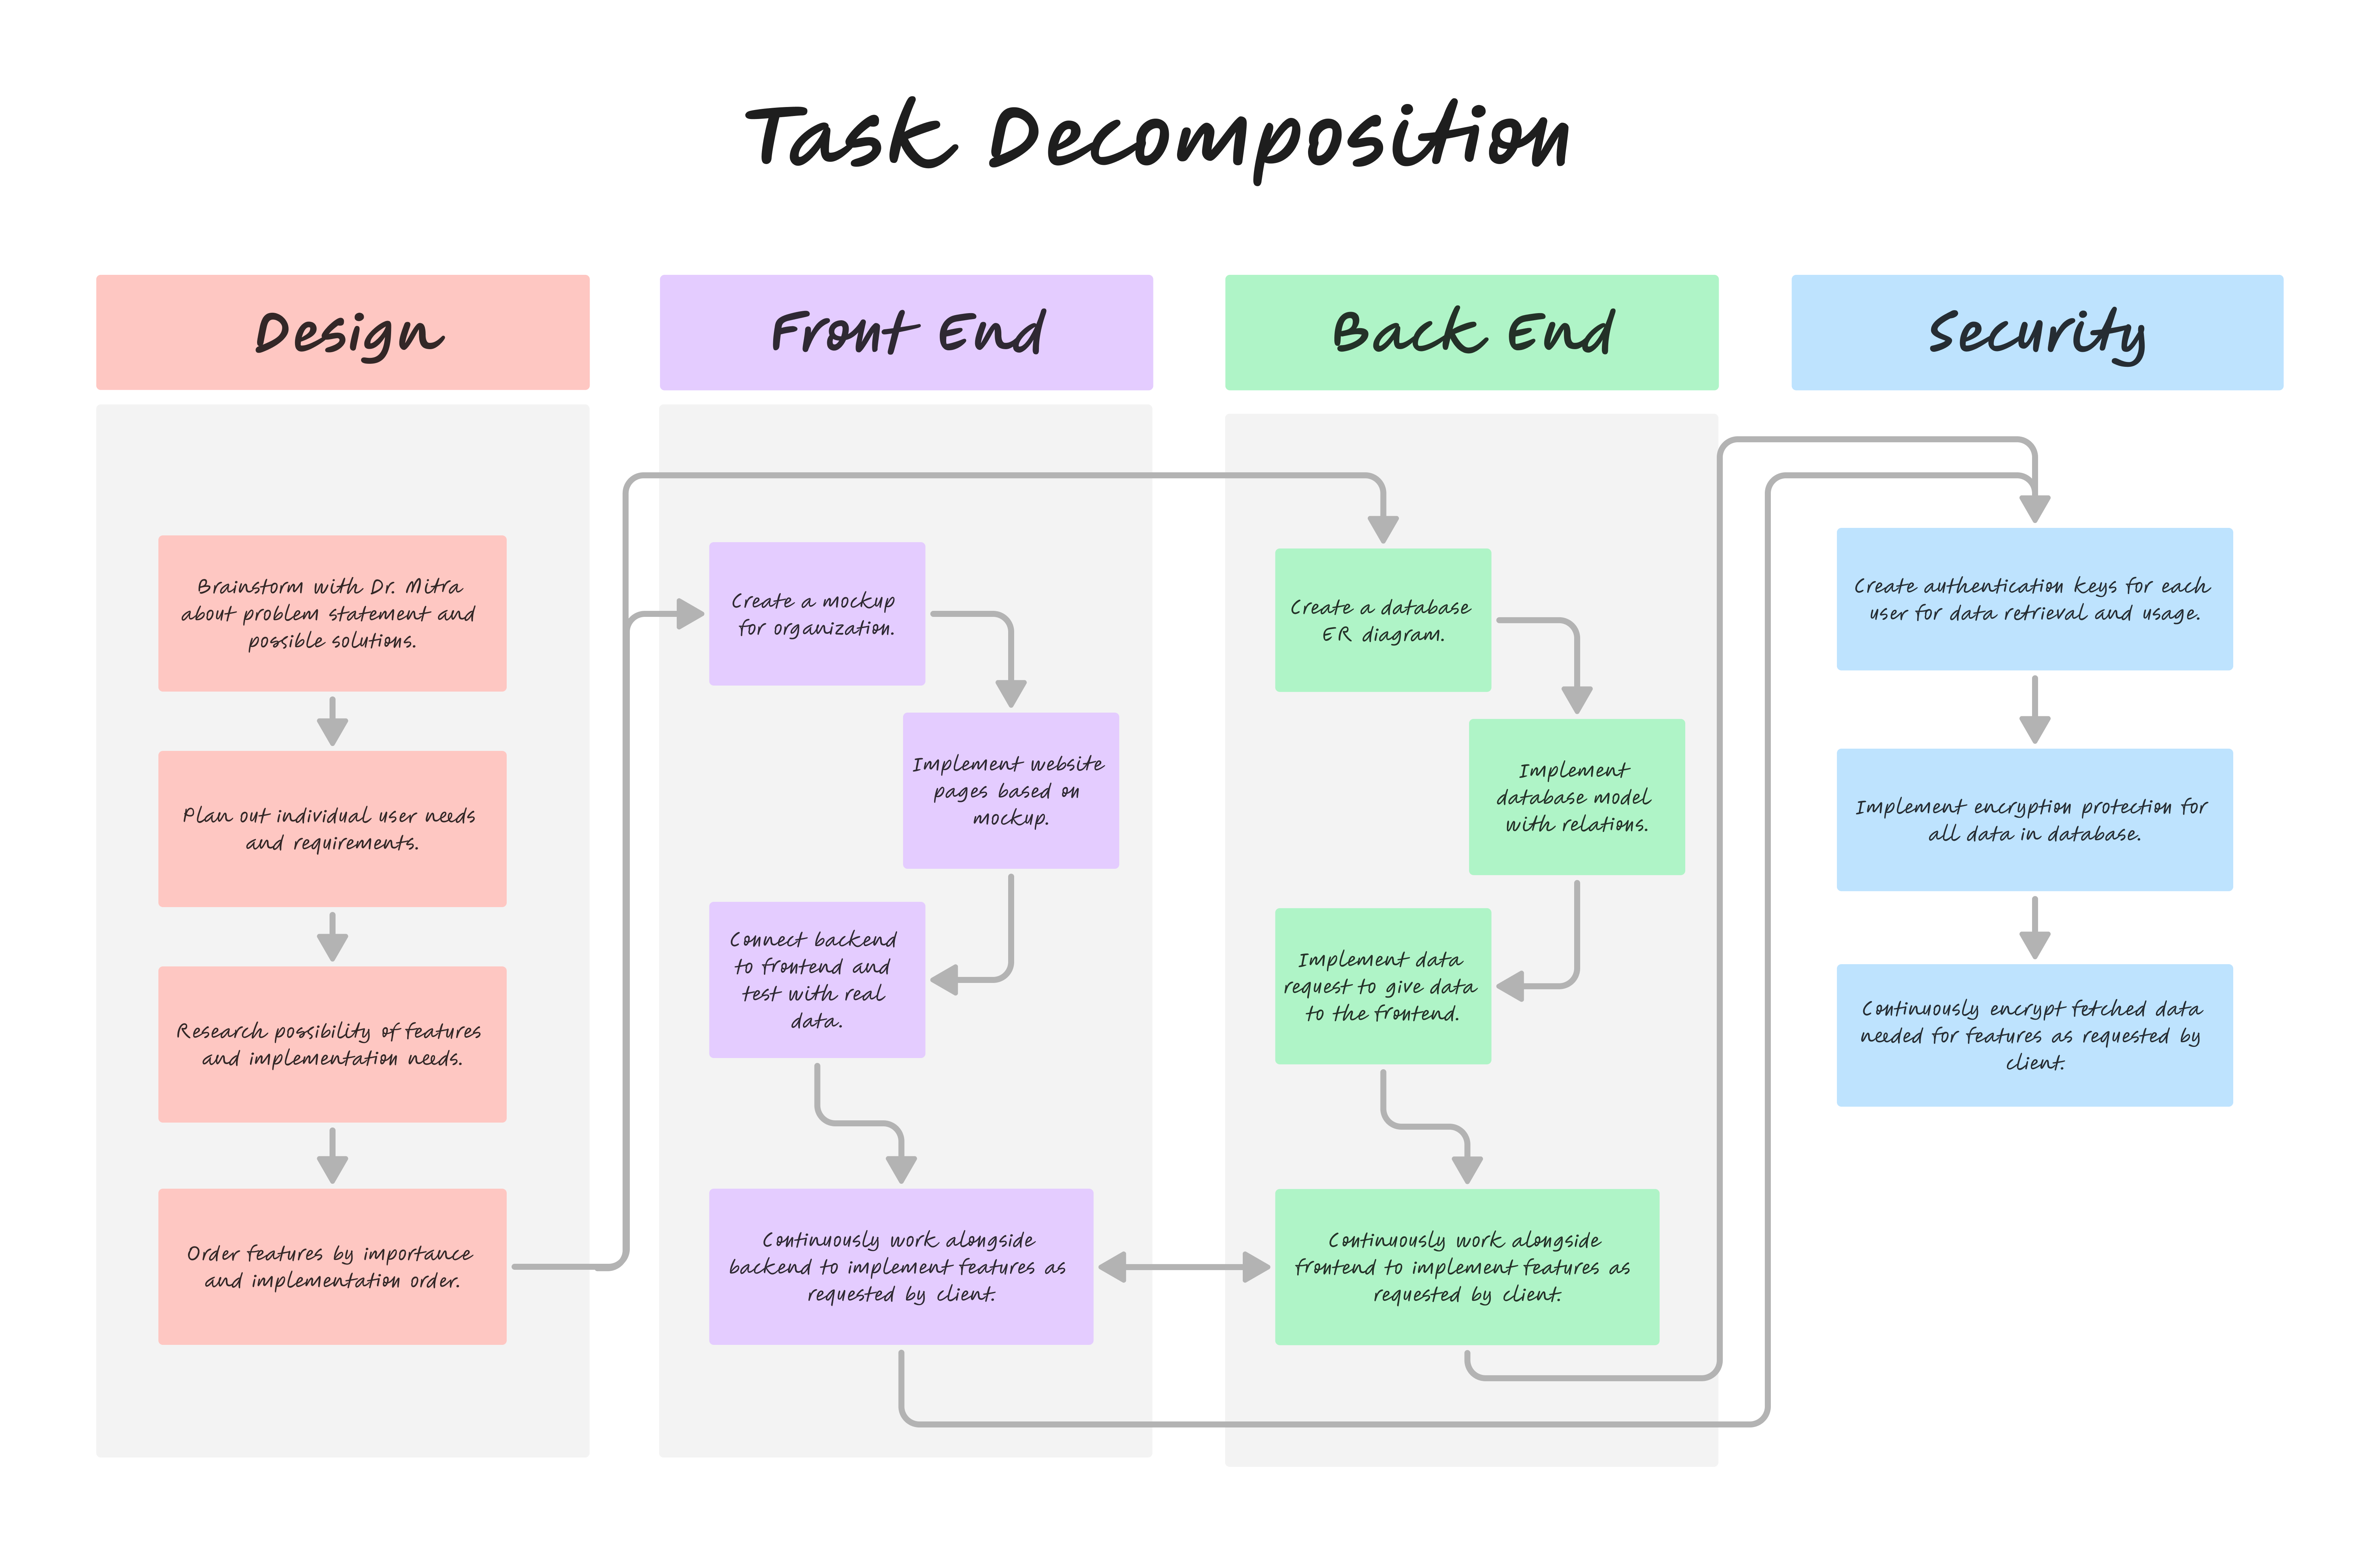
Front End
Screen Flow Diagram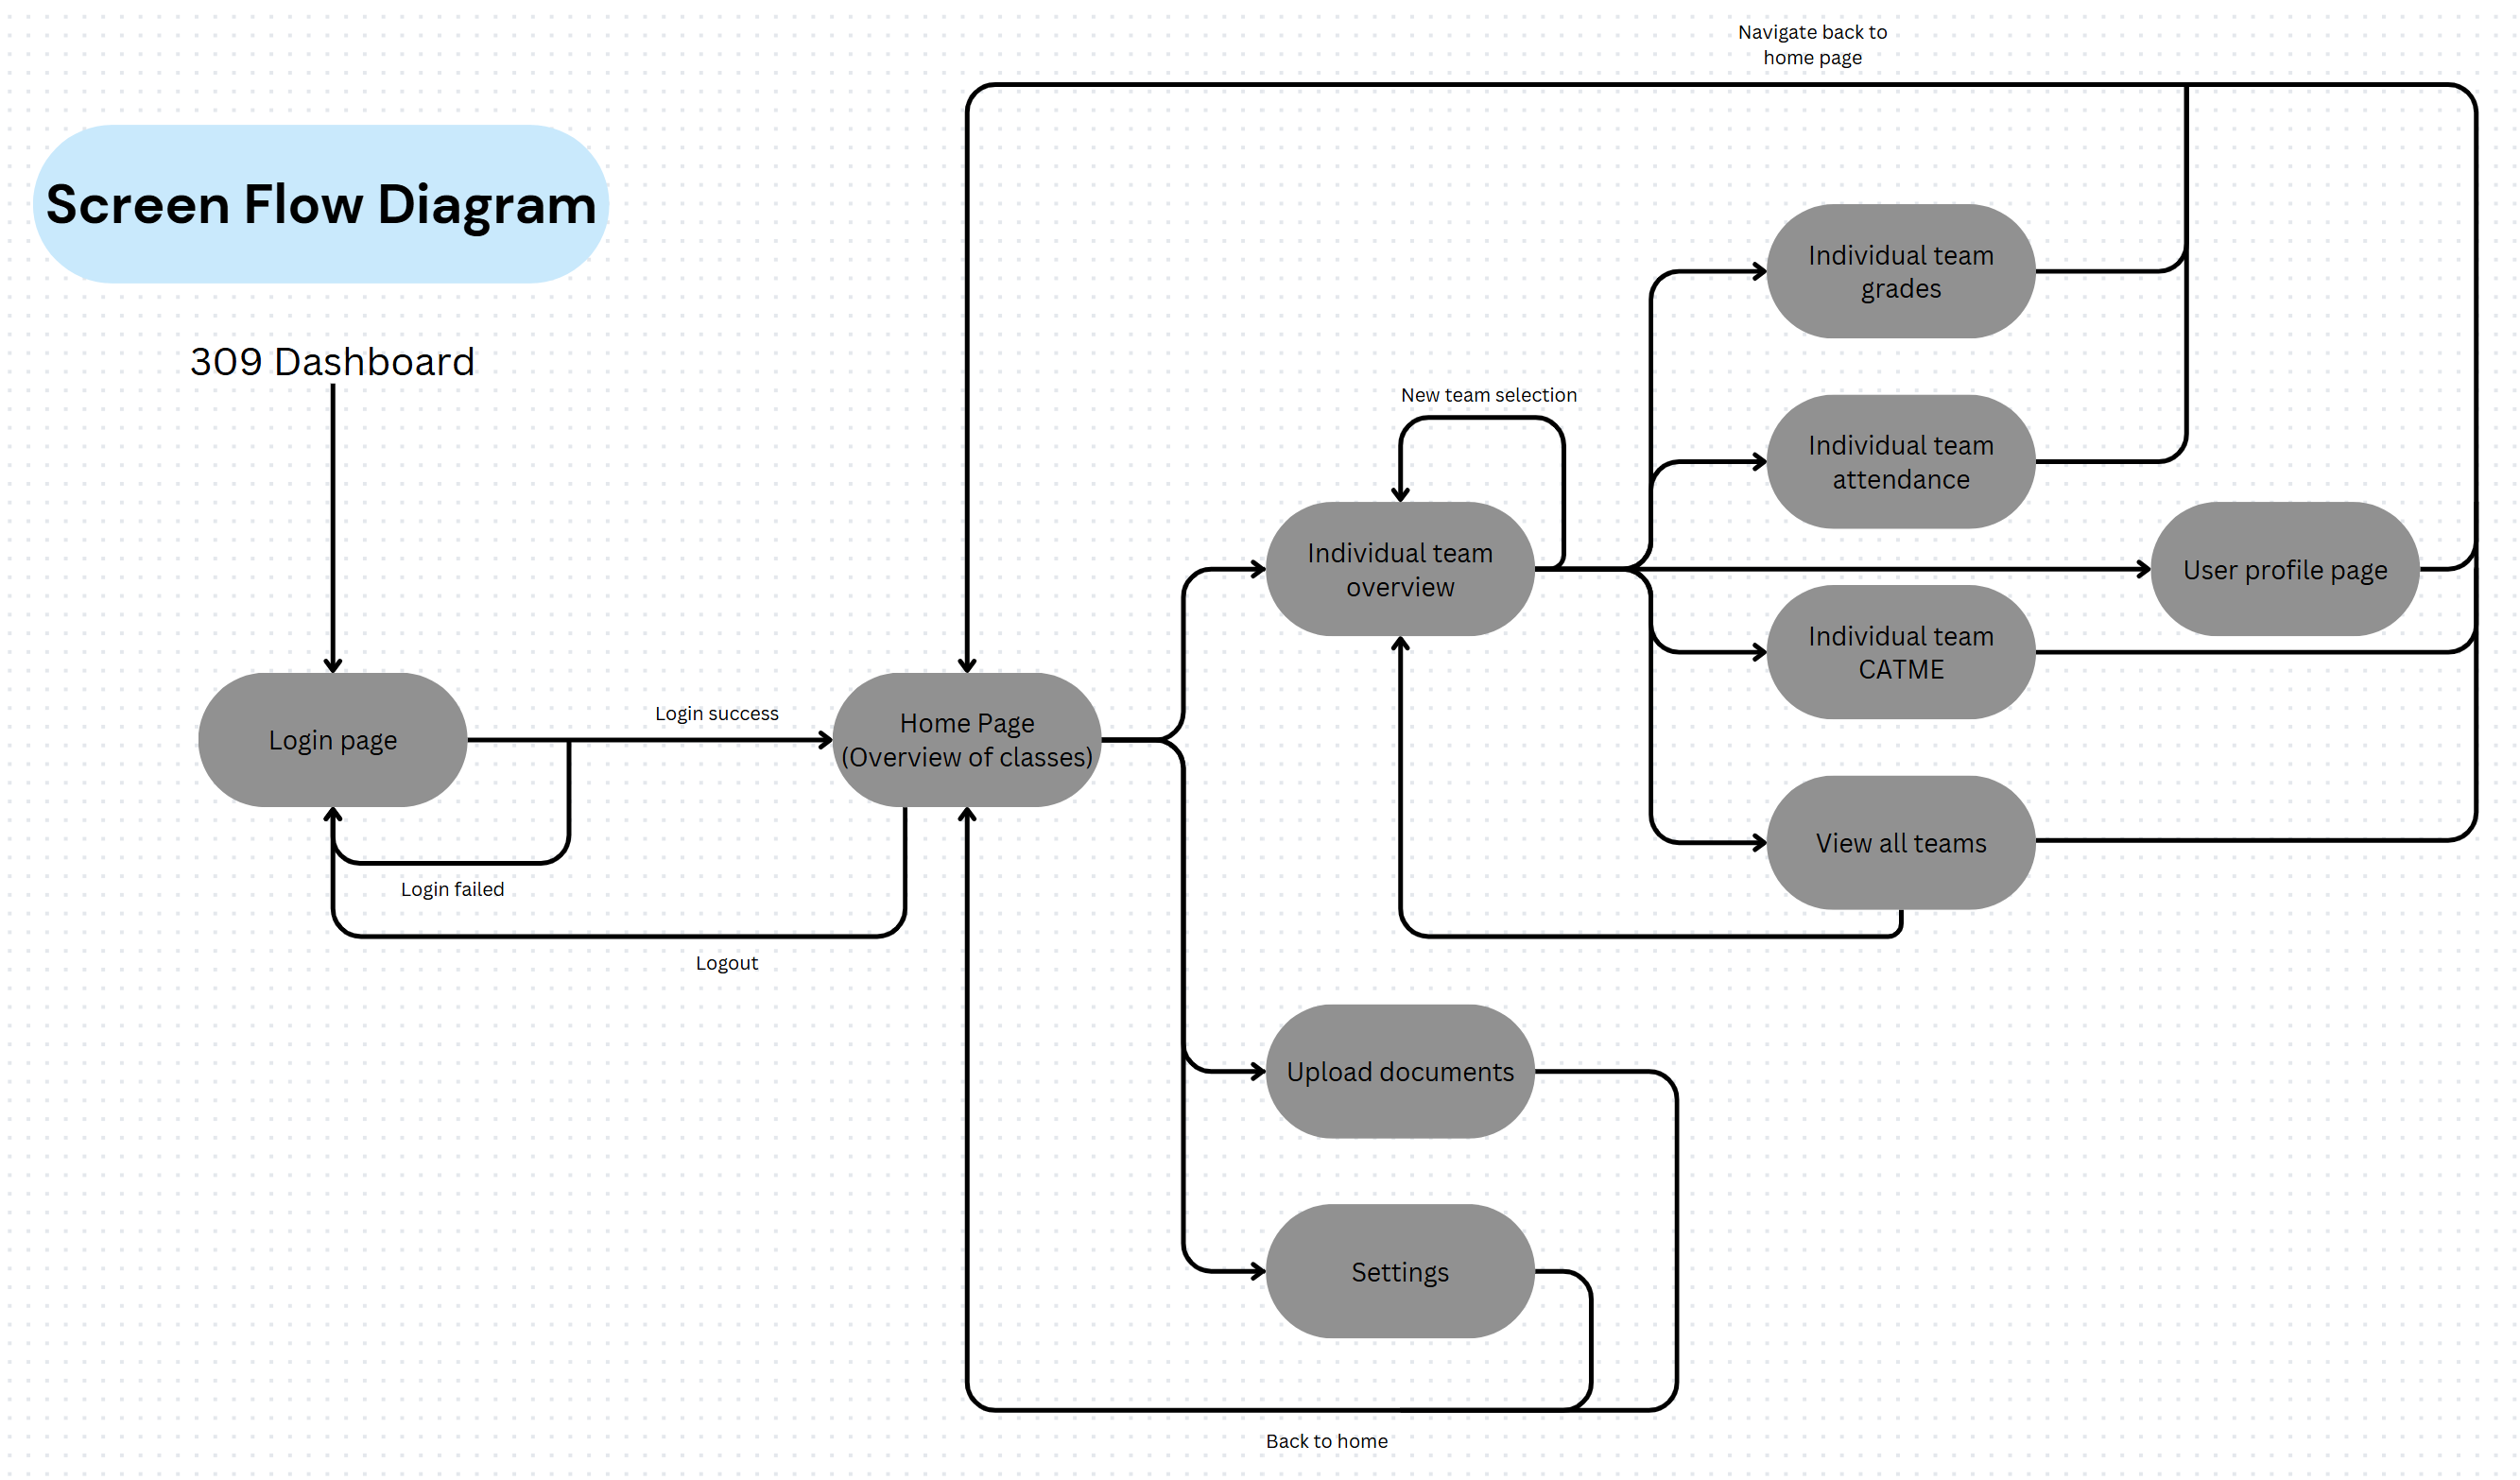
Back End
ER Diagram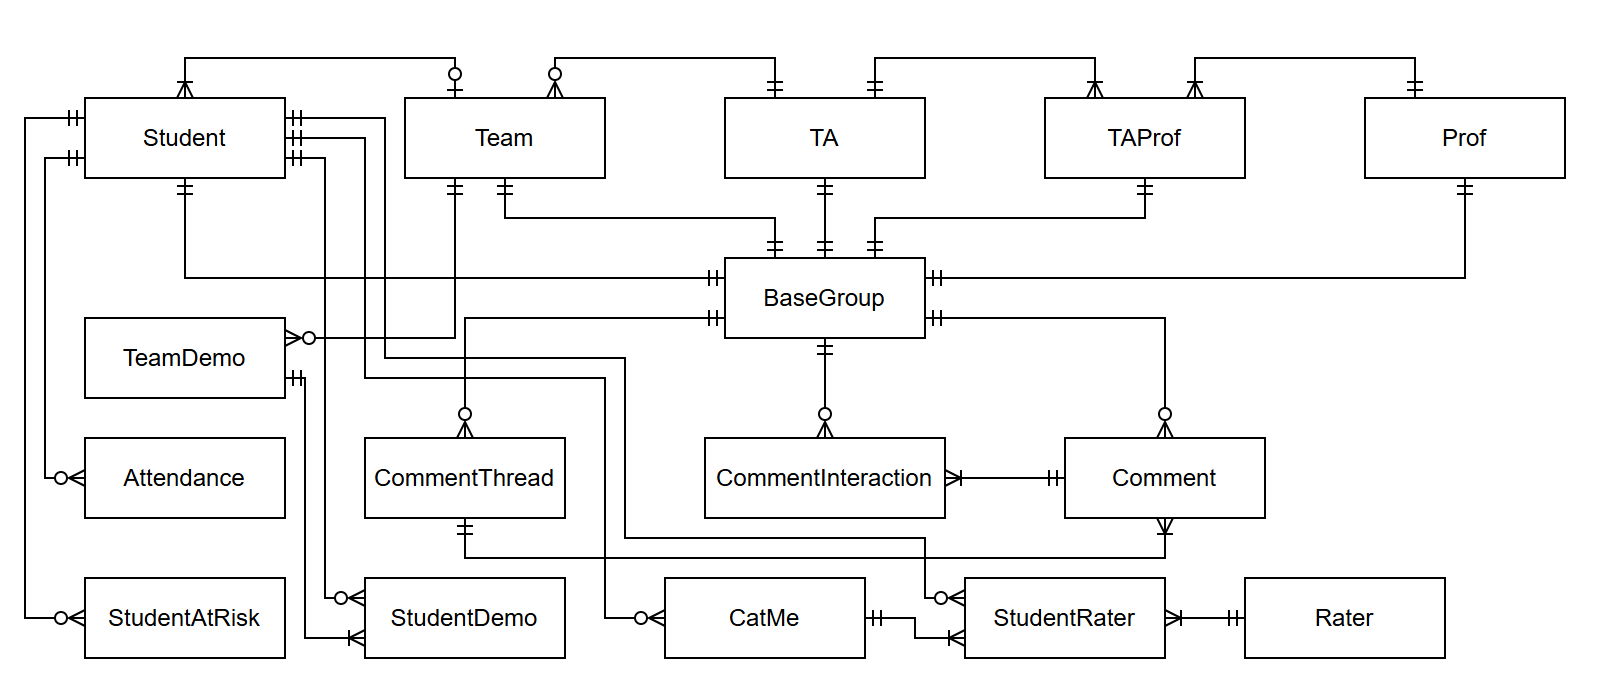
Connectivity
Application Connectivity Diagram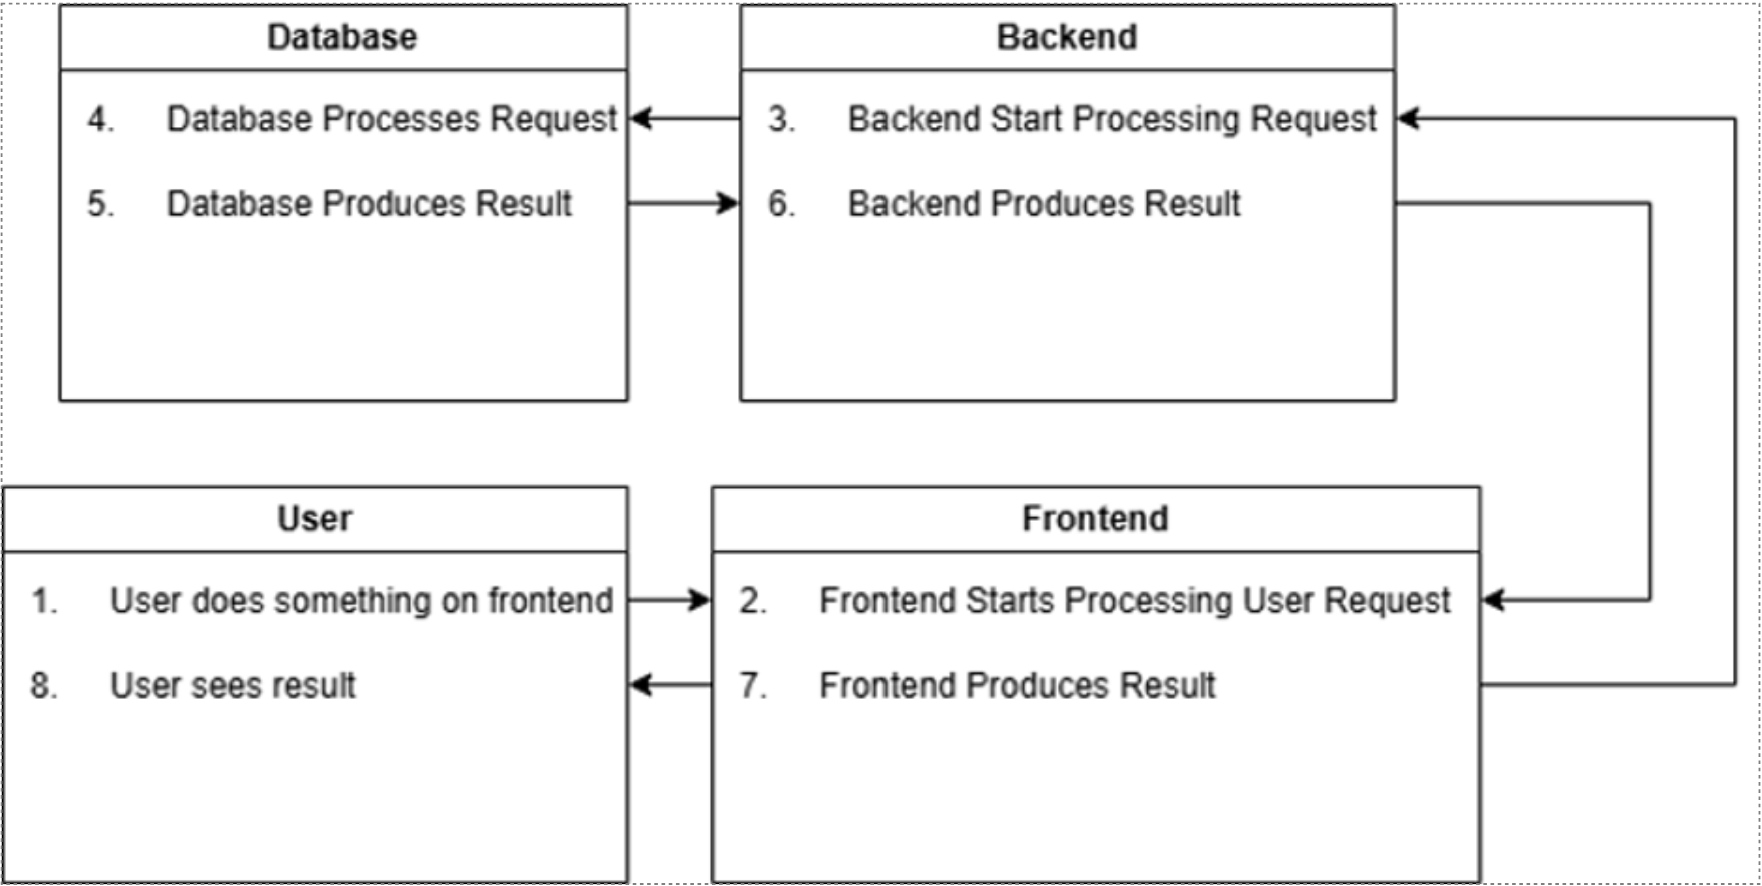
Lightning Talks
(1) Product Research
(2) Problems and Users
(3) User Needs and Requirements
(4) Project Planning
(5) Detailed Design
(6) Contextualization and Design Check In
(7) Prototyping
(8) Ethics and Professional Responsibility